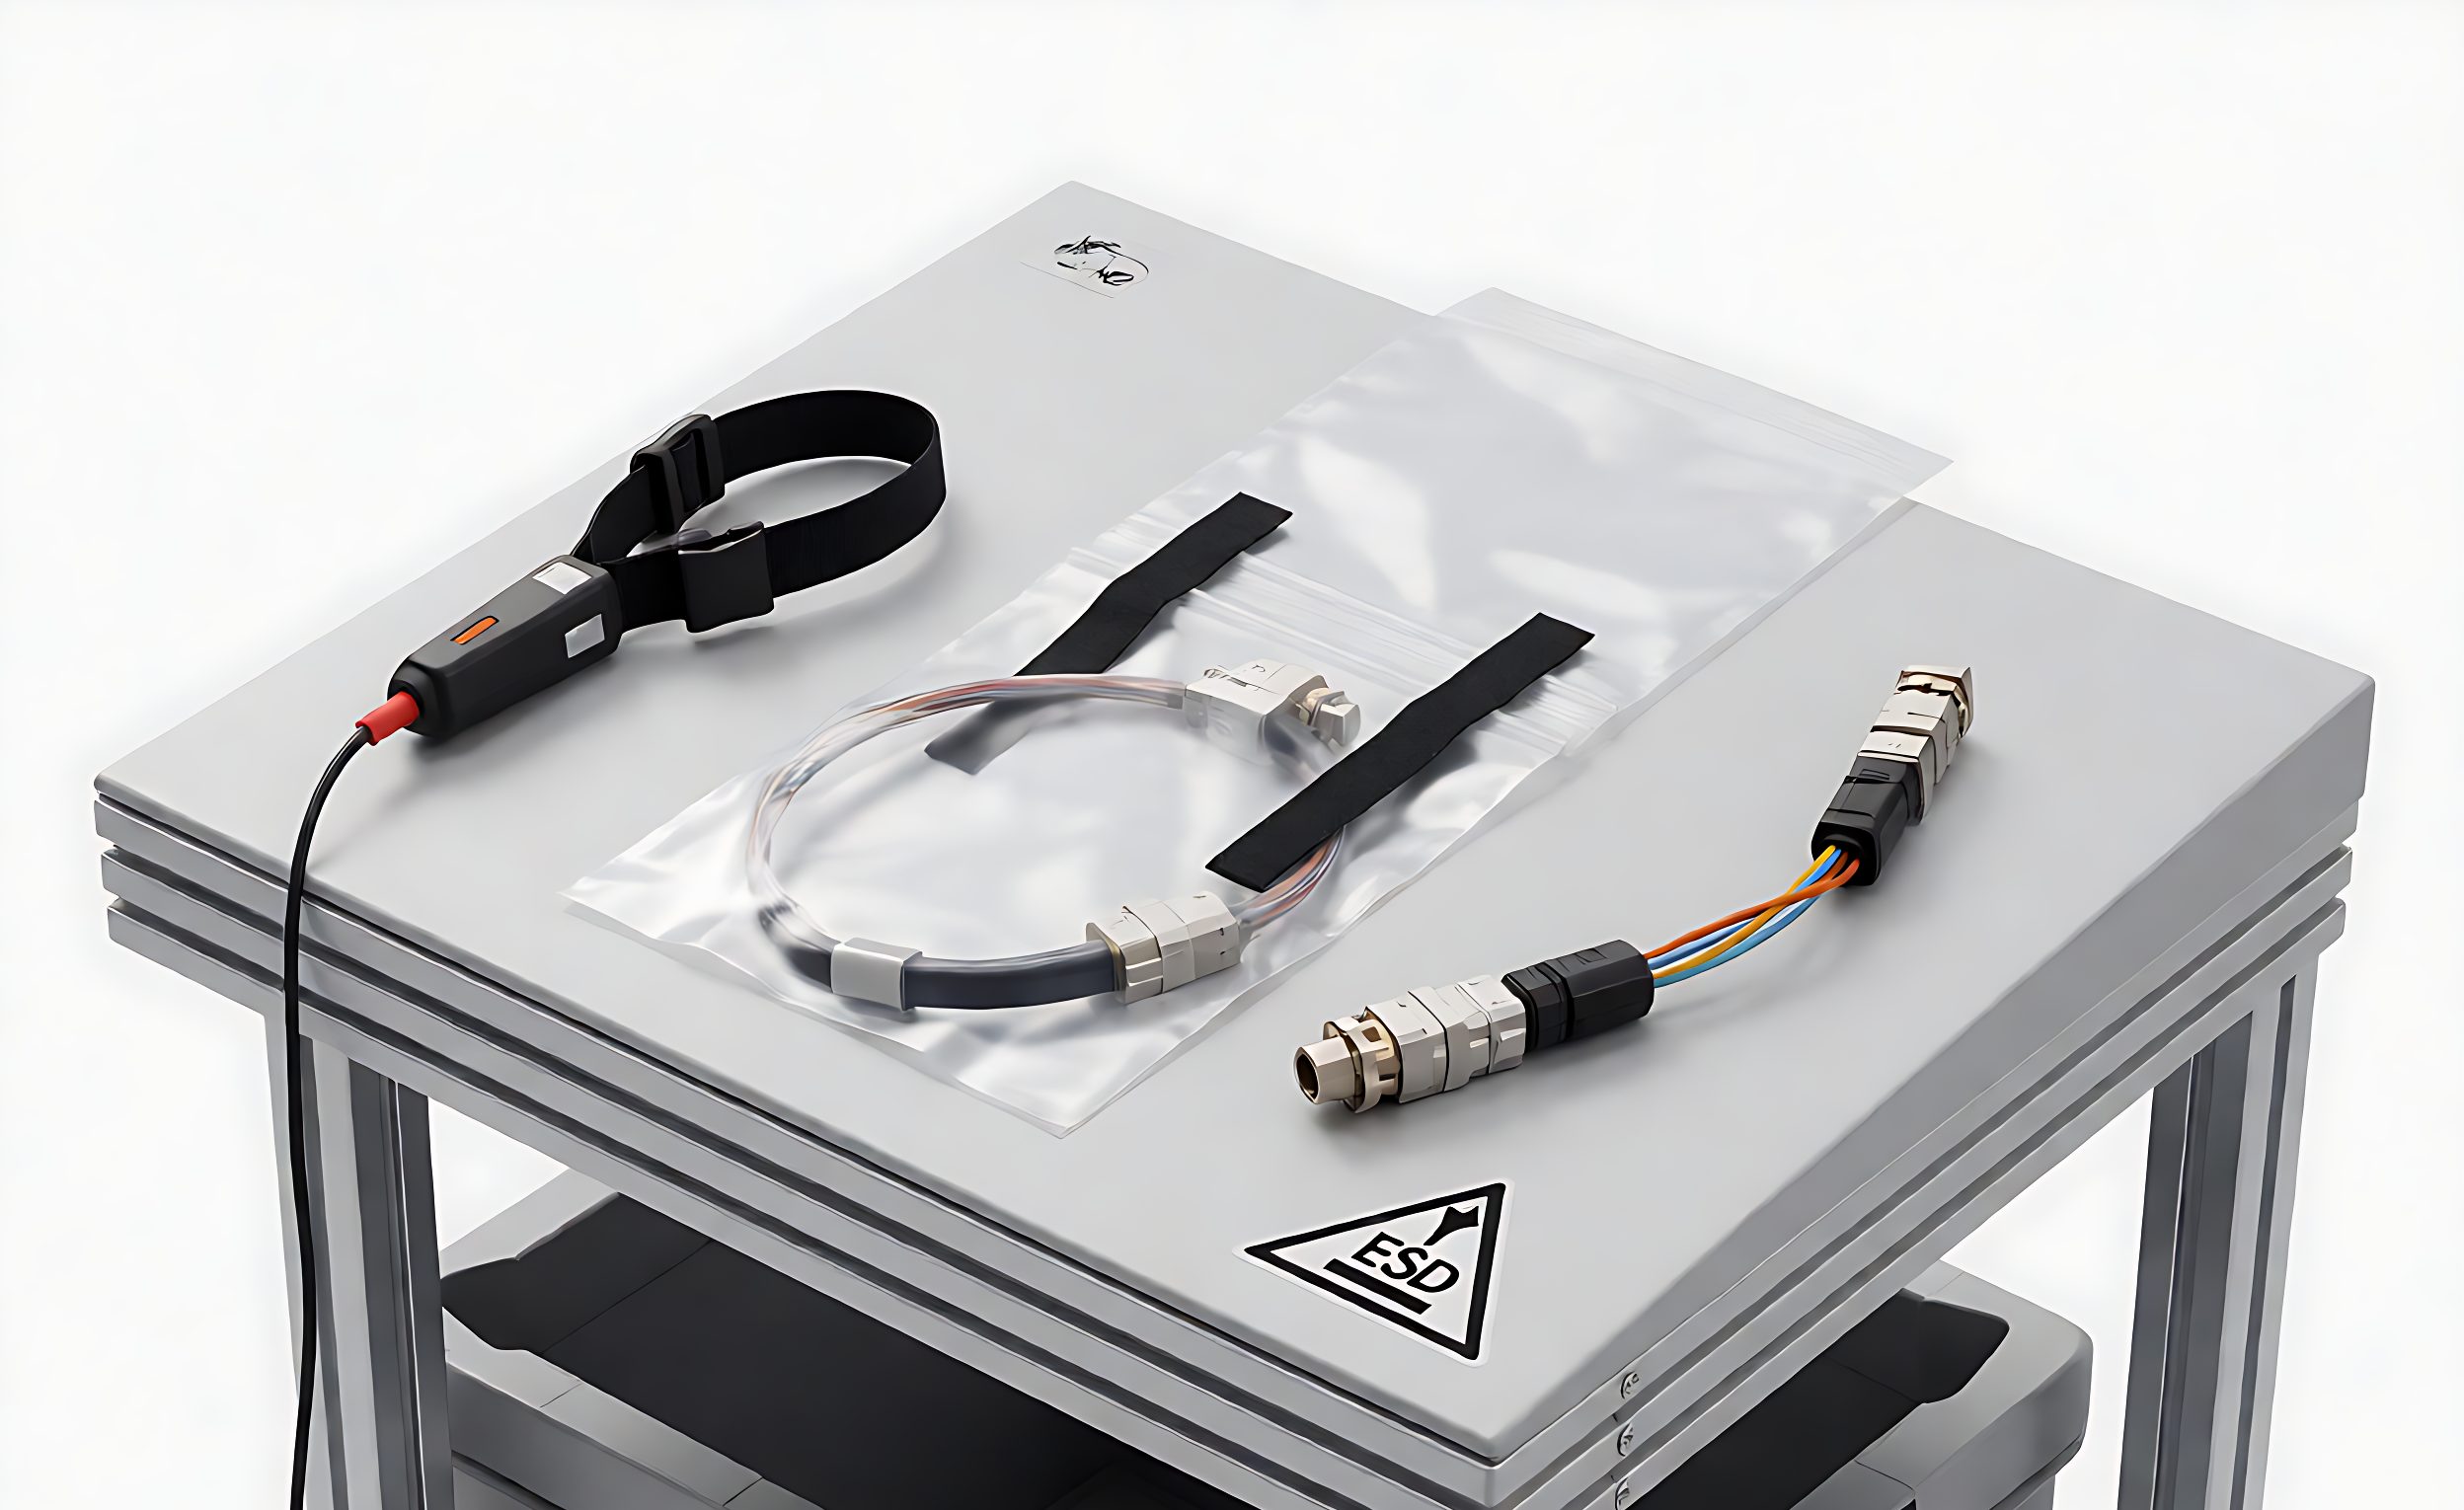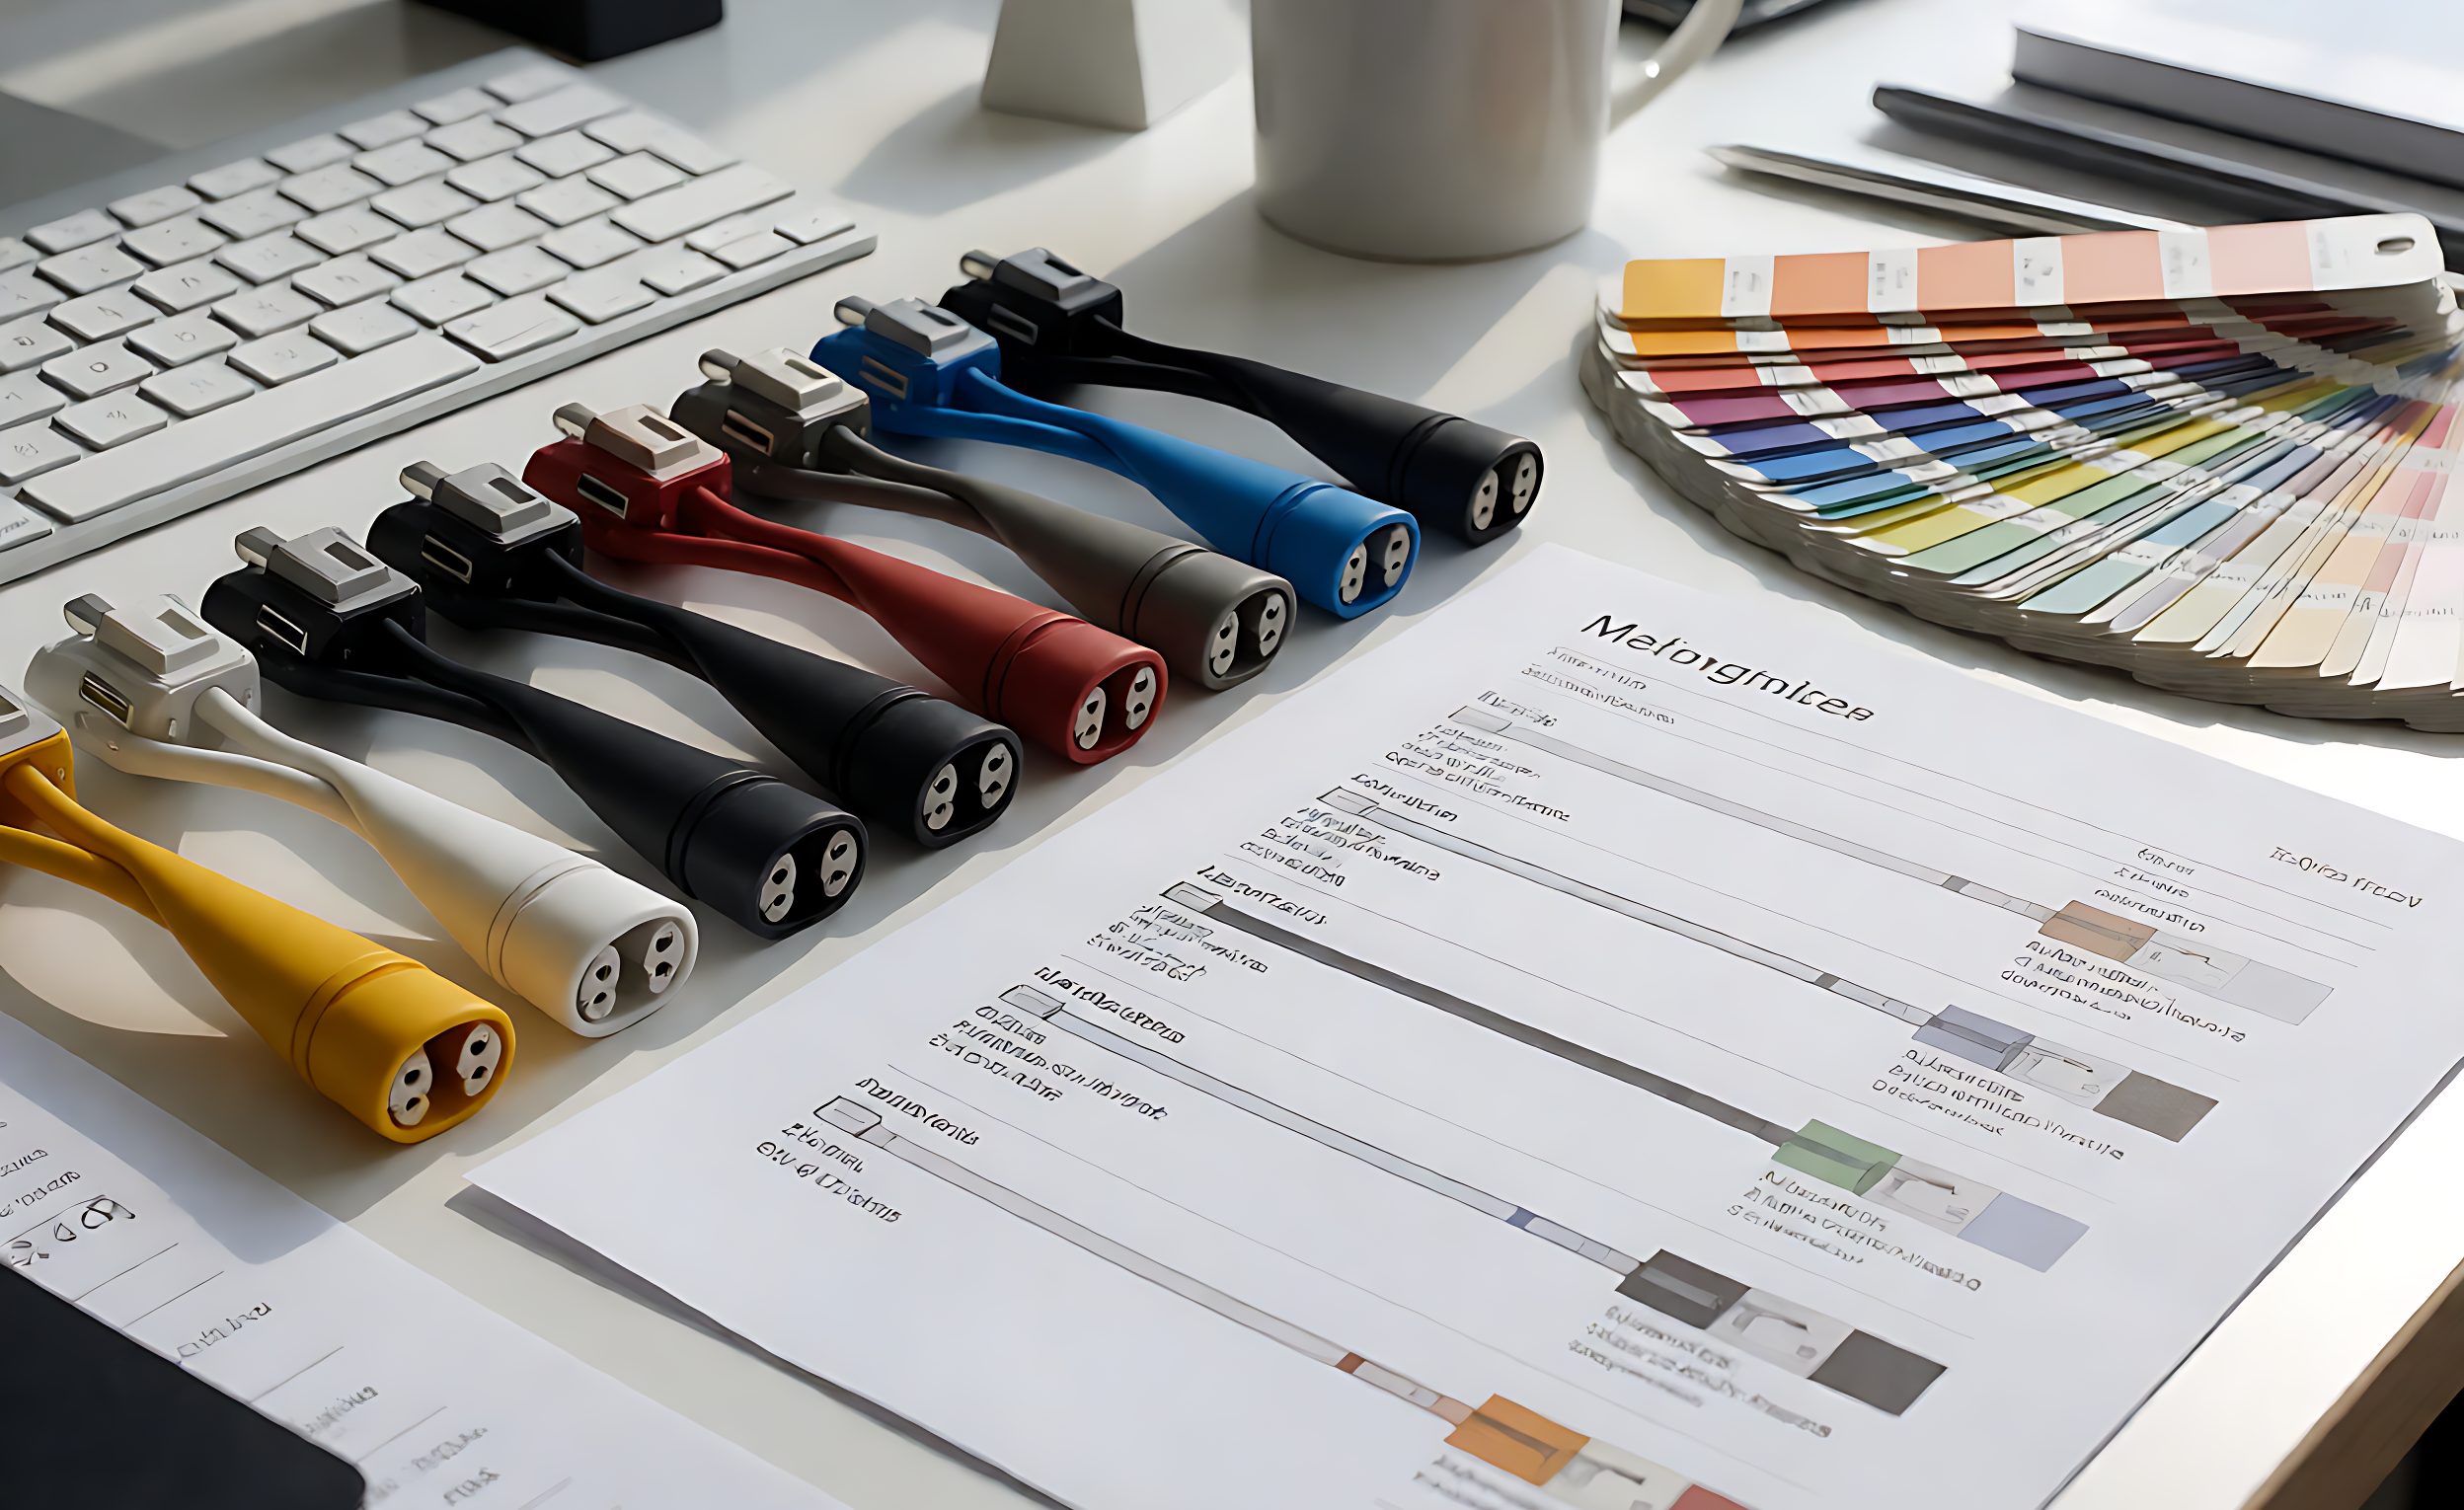

A procurement decision on cable assemblies is usually made on unit price, and the costs that follow the purchase are usually larger. A failure in service costs the replacement part, the labour to fit it, the downtime while the equipment is out, and – for a qualified or regulated product – the re-qualification work that a component change triggers. Those costs are real, they are borne by a different budget from the one that bought the cable, and they are invisible in a quotation comparison.
Total cost of ownership is the discipline of putting all of it into one number per unit, so a comparison reflects reality rather than a line item.

Building the Model
Six components, each with a source:
- Purchase price per unit, including amortised non-recurring charges and freight.
- Expected failure rate over the service life, from field data if you have it, or from warranty returns if you do not.
- Cost of a failure event: replacement part, labour to replace, and any consequential scrap.
- Downtime cost, which is the hourly cost of the line or system being unavailable multiplied by the mean time to restore.
- Spare holdings, since a higher failure rate forces more safety stock.
- Re-qualification cost, if a component change requires testing or documentation to keep an approval valid.
Only the first appears on a quotation. For an assembly inside equipment whose downtime is expensive, the fourth term can exceed the purchase price by an order of magnitude, which is why the cheapest unit is frequently the most expensive choice.
Where the Difference Actually Comes From
Two suppliers quoting the same part rarely differ in the way buyers assume. The differences that matter are usually:
- Termination quality and consistency, which drives the failure rate rather than the price.
- Strain relief design, which decides whether the assembly survives the flexing it will actually see.
- Test coverage, which determines whether a marginal unit ships or is caught.
- Material and plating specification, which affects contact resistance and corrosion life.
Each of these is specifiable. A buyer can require a defined mating cycle rating, a pull test on the termination, 100 percent electrical test, and a stated plating thickness – and then compare on the price of a defined product rather than on the price of an assumption.
Using the Model in a Negotiation
The model changes the conversation with both suppliers and internal stakeholders. With a supplier, it justifies paying more for a defined improvement: a better strain relief or full test coverage is worth a specific amount, and that number is calculable. Internally, it converts a purchasing saving into a business case, because a saving on unit price that raises failure cost is a loss, and the model shows it.
Where the model argues for the cheaper part – a non-critical internal link with no downtime consequence and easy access – it should be allowed to. TCO is not an argument for buying the expensive option; it is an argument for buying the right one.

Technical Background
The method is total cost of ownership, which accounts for acquisition plus operating and failure cost. The reliability input is often expressed through mean time between failures, which converts a failure rate into an expected interval. The consequence being priced is downtime, whose cost depends on the system the part sits in rather than on the part.
Getting the Data
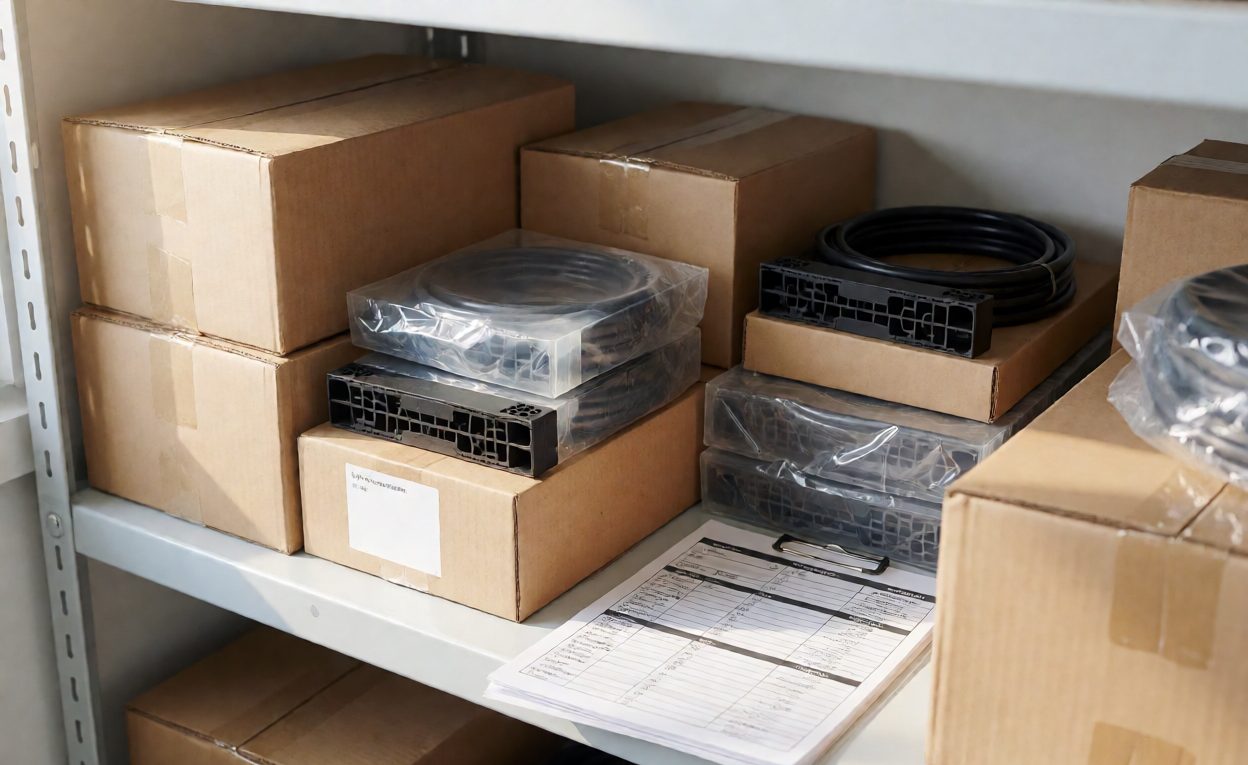
The model needs failure data, and most organisations have more than they think: warranty claims, service logs, and spare part consumption all carry it. Where a new programme has no history, use the supplier’s test data as a starting point and treat it as provisional, then replace it with field data as it accumulates.
Where the model is used to justify a higher-priced part, present it as a range rather than a point estimate. Failure rates vary, downtime costs are estimates, and a single precise figure invites an argument about inputs instead of a decision. A range showing that the conclusion holds across plausible values is far more persuasive, and it survives scrutiny when someone challenges the assumptions.
Track two numbers per part number: failures per thousand installed per year, and mean time to restore. Both are cheap to collect once someone owns them, and they turn a TCO model from an estimate into a measurement. Revisit the model annually: failure rates and downtime costs both drift, and a stale model produces confident wrong answers.
Cost modelling connects to the price build-up in cable quotation cost drivers and to failure investigation in failure analysis. Durability expectations are discussed in connector durability, specification discipline in specifying gauge and power rating, and supplier selection in choosing a manufacturer.
Preguntas Frecuentes
Why is unit price a poor comparison?
Because failure cost, downtime and re-qualification usually exceed the purchase price for assemblies inside critical equipment.
What is the largest hidden cost?
Typically downtime, because it scales with the cost of the system being unavailable rather than with the part.
Does TCO always favour the expensive part?
No. For non-critical links with no downtime consequence, the cheaper part often wins – the model identifies which case applies.
What data does the model need?
Failures per thousand installed per year and mean time to restore, both of which are cheap to collect once owned.
How do I get failure data for a new programme?
Start with supplier test data as provisional and replace it with field data as it accumulates.
Can I specify reliability improvements?
Yes: mating cycle rating, pull test on terminations, full electrical test coverage and stated plating thickness.
Who should own the TCO model?
Ideally whoever carries the failure cost, so the number reflects consequences rather than only the purchasing budget.